Portfolio

JohnKirima©

Data Scientist & Analytics

Data Scientist & Decision Intelligence Engineer · B.S. Business Analytics & Information Systems, University of Iowa · Iowa City, IA

I'm John Kirima, a data analyst and applied data scientist focused on turning messy information into clear, useful decisions. I build decision systems that combine forecasting, optimization, and machine learning to turn uncertainty into margin for businesses that can't afford to guess.

More about me
ForecastingOptimizationDecision IntelligenceMachine LearningAutomation
(Selected Work)

Successful
Projects

Built end-to-end as a full case study with production-ready artifacts (model, feature list, imputer, and scoring functions). Each project below turned messy, ambiguous data into decisions that moved the numbers, from recovered revenue to optimized operations.

Predictive Markdown Intelligence fashion retail case studyView Case Study
04Flagship

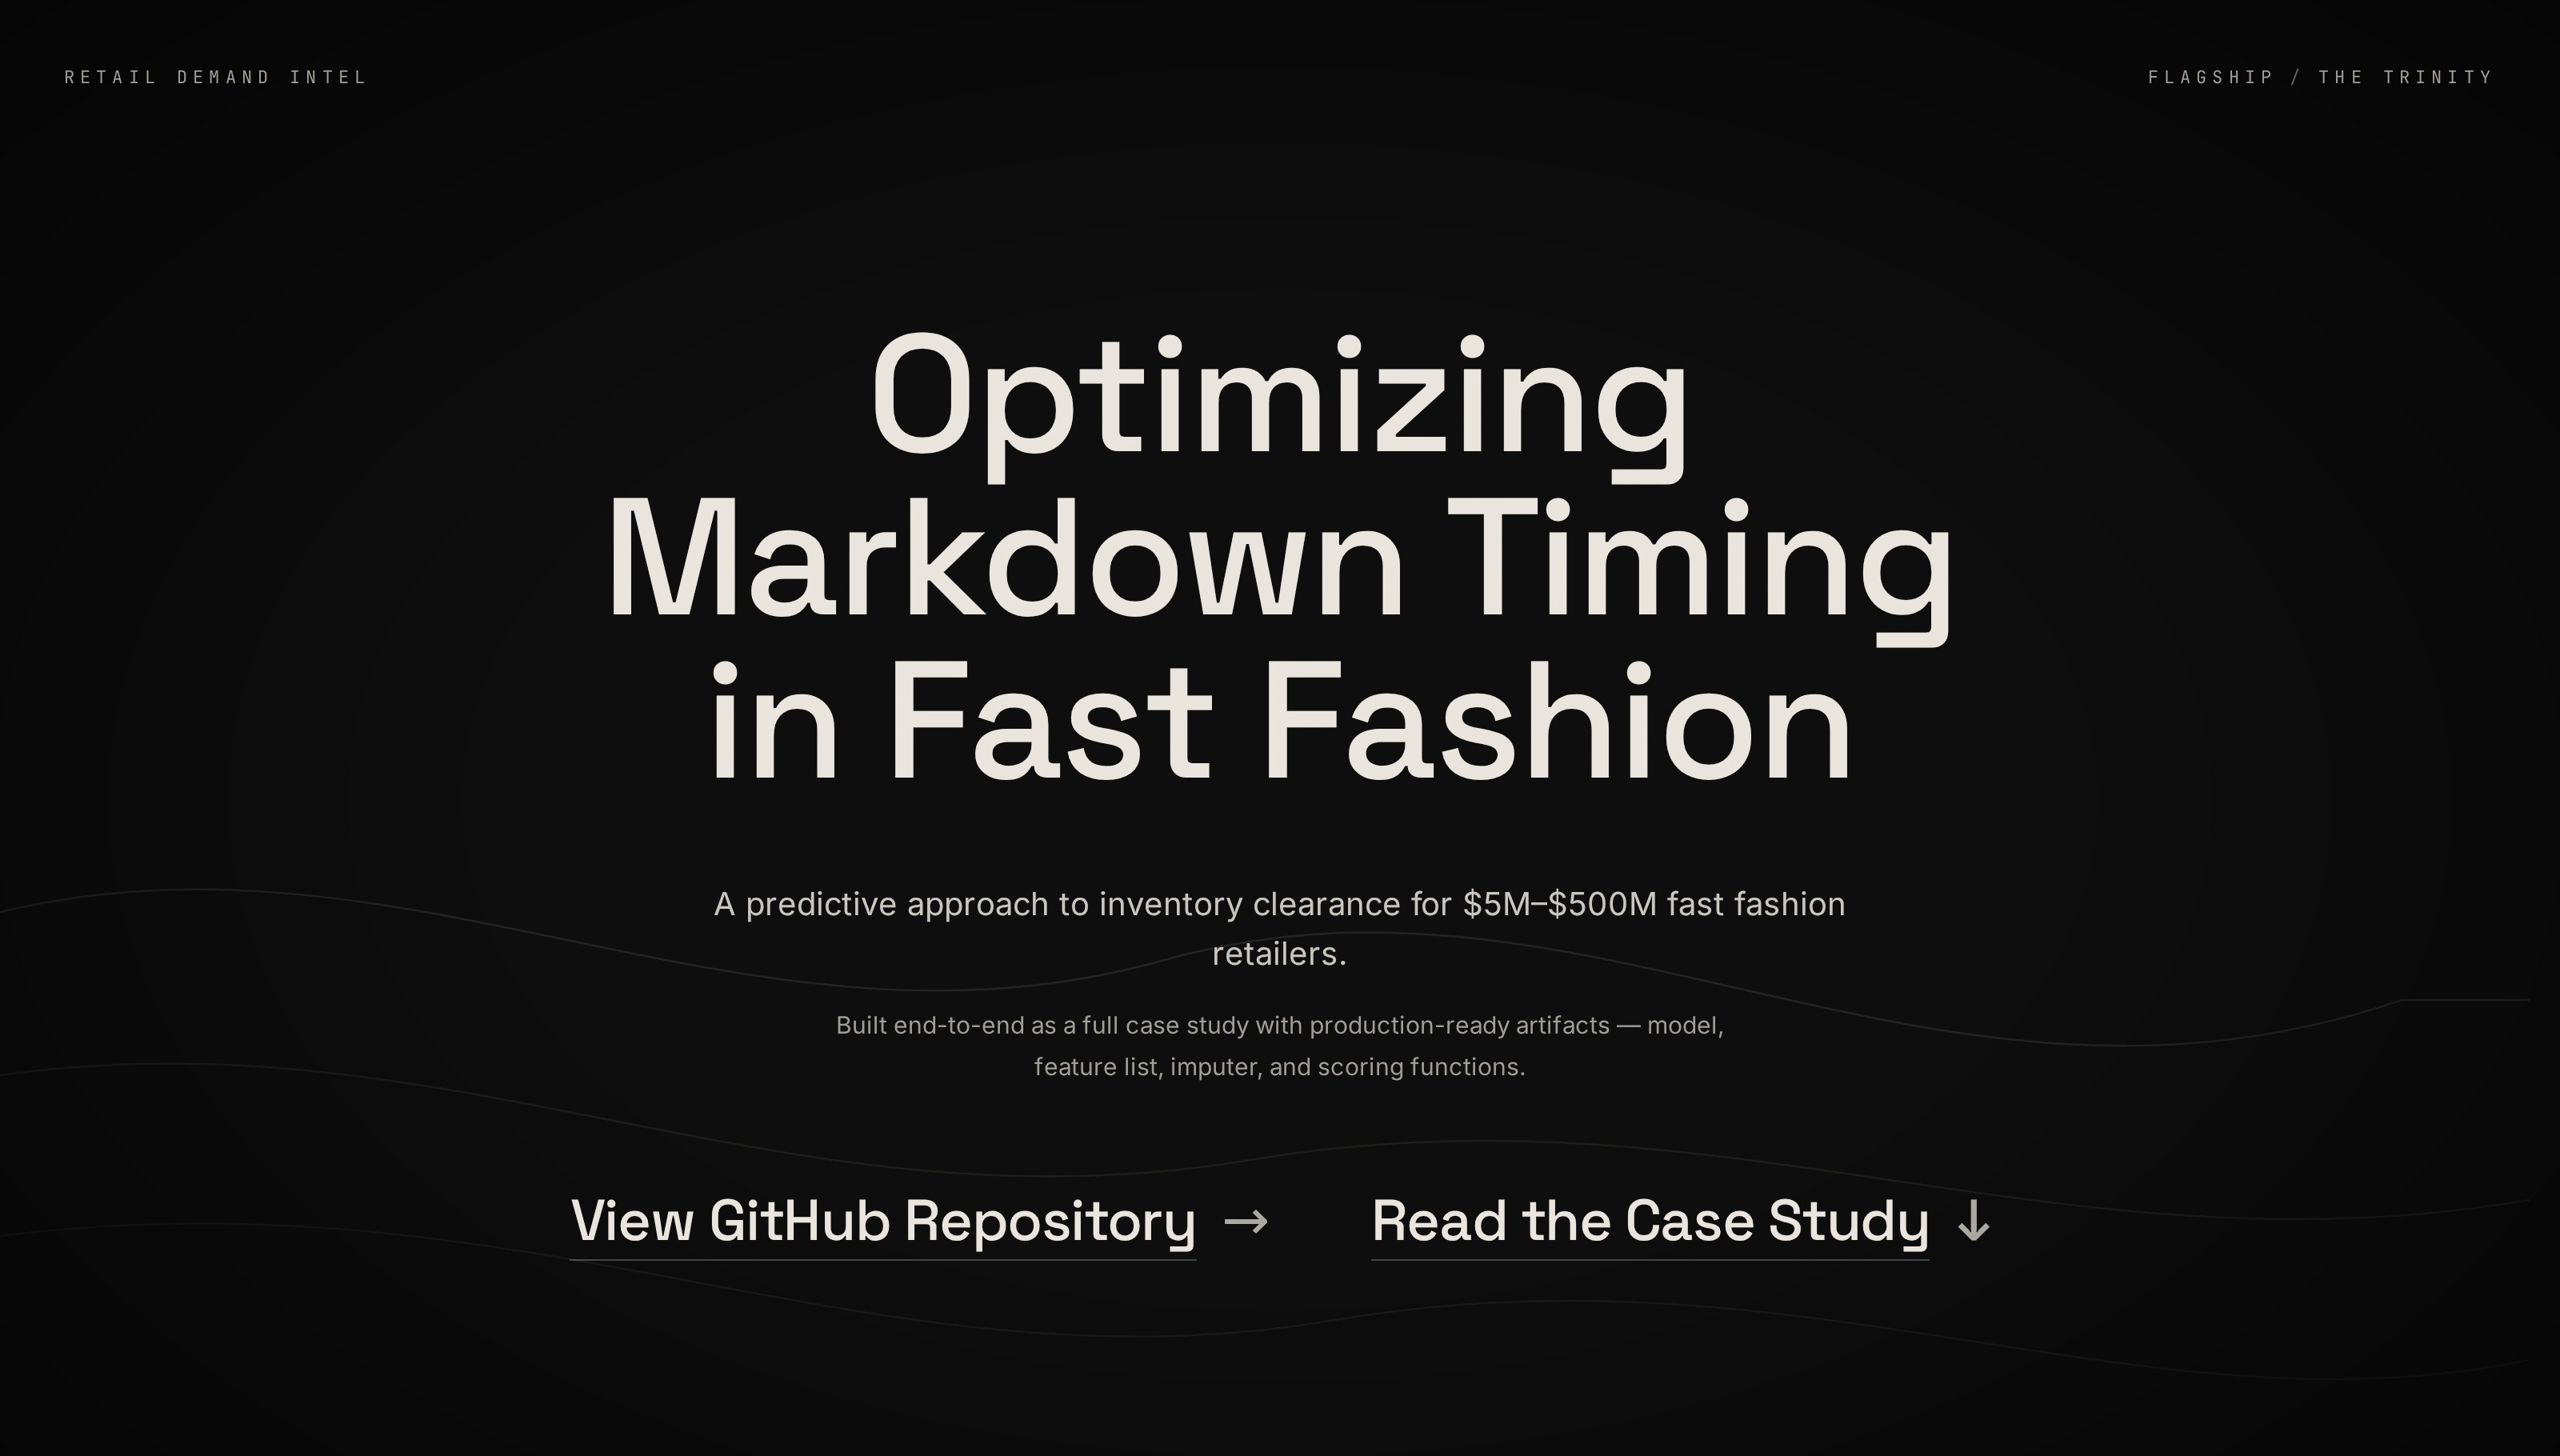
Optimizing Markdown Timing in Fast Fashion A Predictive Approach to Inventory Clearance

  • A machine-learning system that helps fashion retailers time markdowns better and reduce inventory waste.
  • Built end-to-end with production-ready artifacts — model, feature list, imputer, and scoring functions.
Python / XGBoost / Tweedie / Pandas / Feature Engineering

Customer Review Analytics for Fintech Decision Making case studyView Case Study
01Flagship

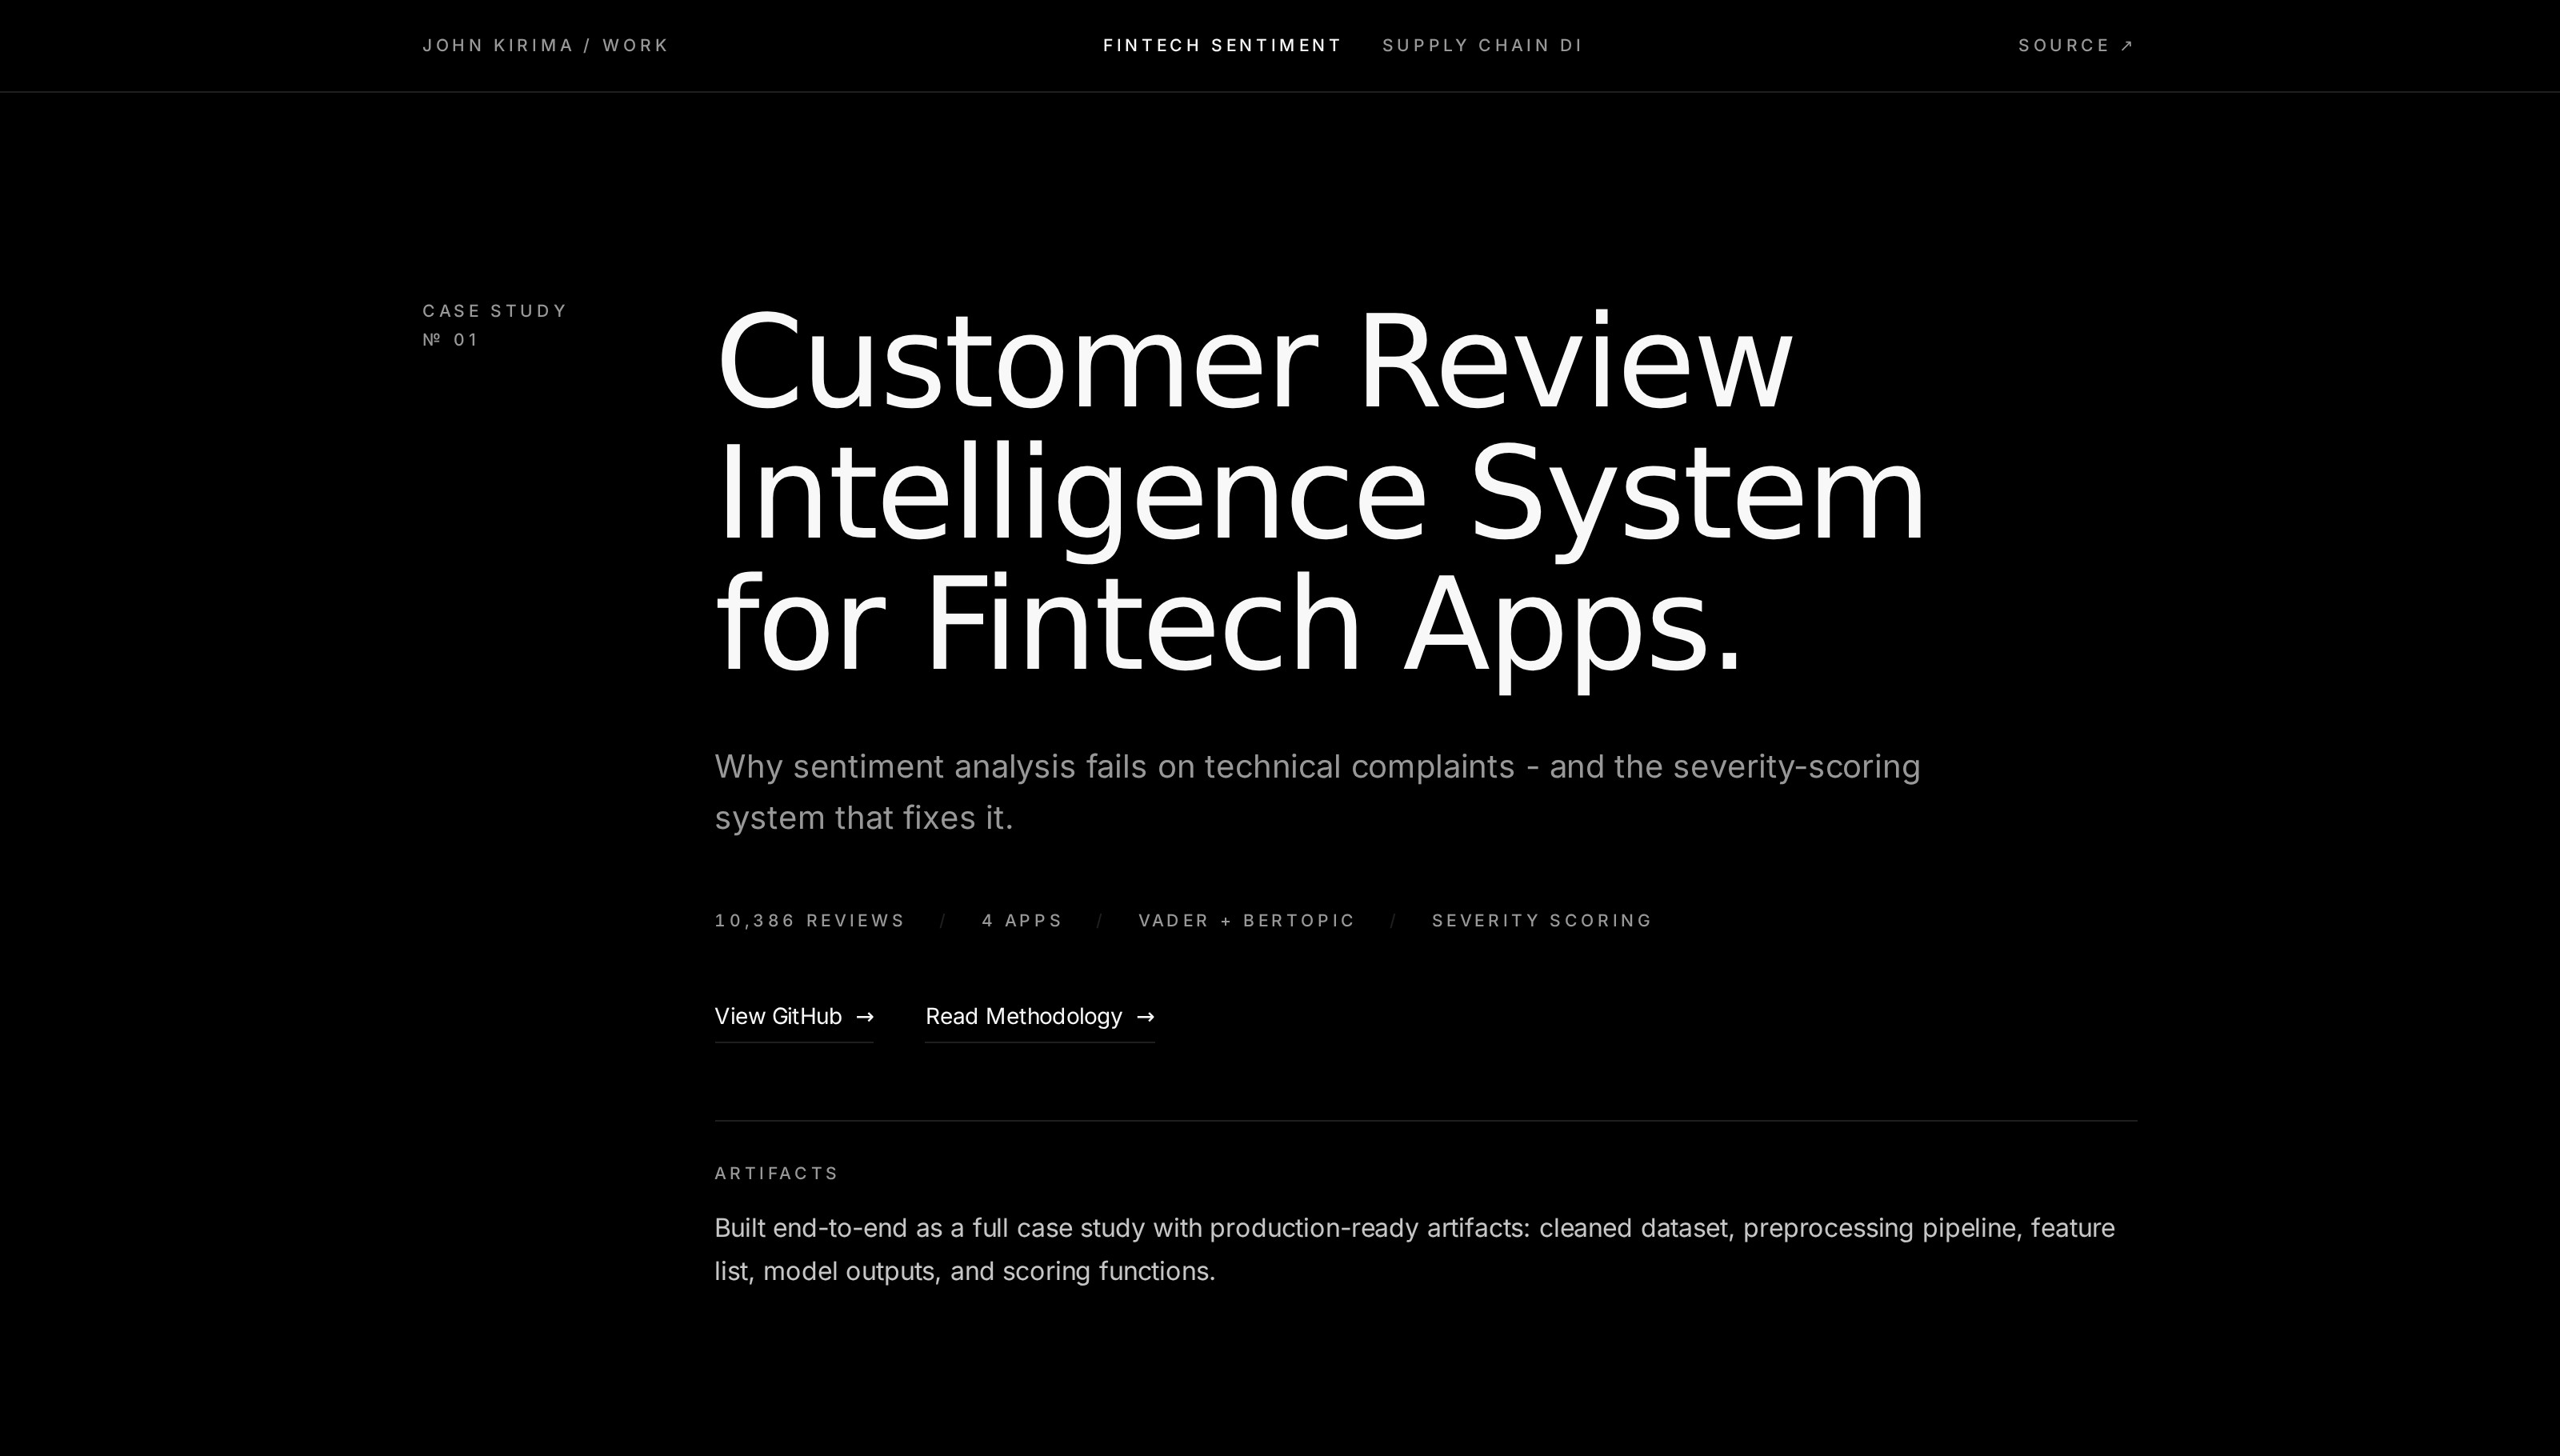
Customer Review Analytics for Fintech Decision Making

  • An NLP system that helps fintech teams find the customer complaints that actually predict churn and operational risk.
  • Built end-to-end with production-ready artifacts — cleaned dataset, preprocessing pipeline, feature list, model outputs, and scoring functions.
Python / NLP / Scikit-Learn / Transformers / Feature Engineering
Multi-warehouse inventory allocation under demand uncertainty case studyView Case Study
02Flagship

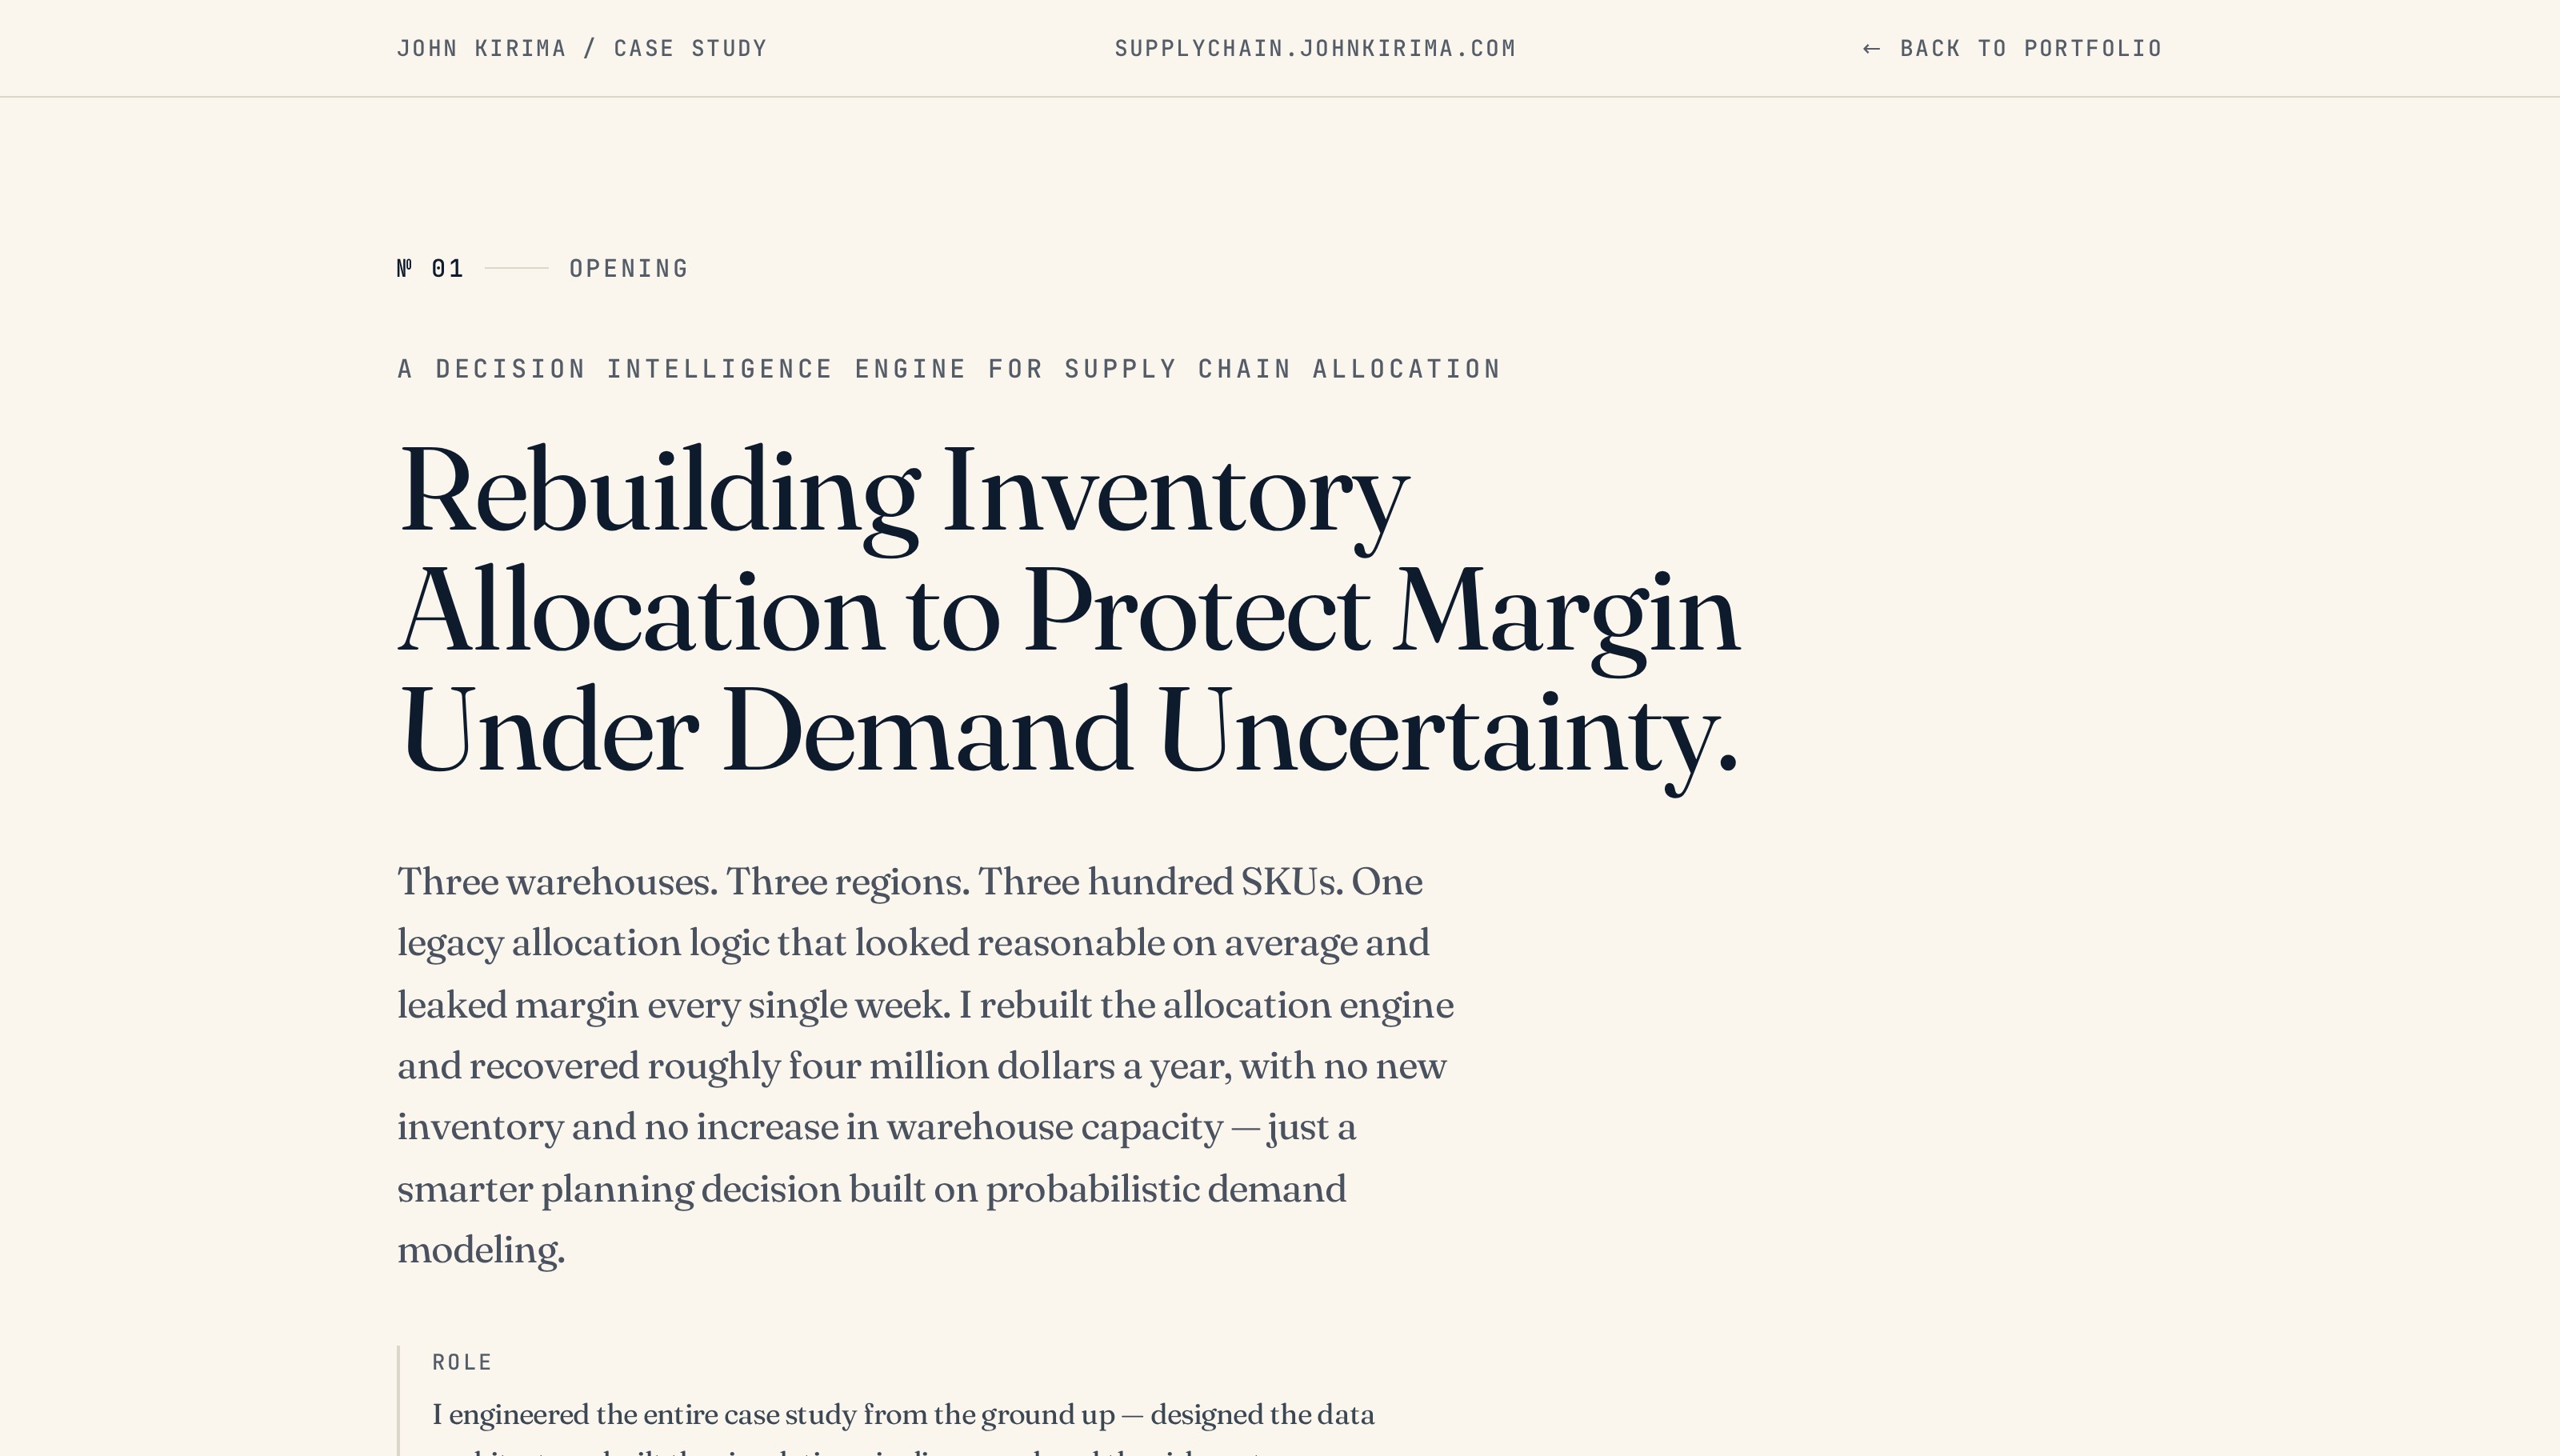
Multi-Warehouse Inventory Allocation Under Demand Uncertainty

  • A decision-intelligence engine that reallocates inventory across three regional warehouses when weekly demand is uncertain.
  • Cuts modeled weekly cost from $142K to $65K (~54%, ~$4M/year) and flags 44 SKUs as capacity-expansion candidates.
Python / Pandas / NumPy / SciPy / PuLP / Monte Carlo / Matplotlib / Seaborn
DataForge multi-agent terminal automation
03Flagship

Multi-Agent Data Science Automation (DataForge)

  • Terminal-based system orchestrating 9 AI agents
  • Fully automated EDA, data cleaning, and insight generation
Example workflow
$ dataforge run --pipeline full
[Agent 1]  →  Data cleaning complete (14 columns standardized)
[Agent 2]  →  Outlier detection flagged 47 anomalies
[Agent 9]  →  Executive summary generated
Python / LLM APIs / Claude 3.5 / DeepSeek V3 / Agentic Workflows

About

01 / 05
Portrait of John Kirima

I'm John Kirima, a data analyst and applied data scientist focused on turning messy information into clear, useful decisions.

My work sits at the intersection of analytics, machine learning, and systems thinking. I like projects that go beyond surface-level reporting and push toward explanation, structure, and business meaning.

At a glance
Education
B.S. Business Analytics & Information Systems — University of Iowa, Tippie College of Business

Tools / Capabilities

04 / 05

I turn messy data

into decisions.

I build models

that hold up.

I obsess over

the details others miss.

(01)

Analytics & Programming

Python, SQL, Oracle APEX, HTML/CSS

(02)

Data & Visualization

Power BI, Microsoft Excel, ETL Processes, Data Cleaning

(03)

AI & Machine Learning

Machine Learning, Statistical Analysis, SHAP Interpretability, LLM Integration, Multi-Agent Systems, NLP, BERTopic, VADER, Sentiment Analysis

(04)

Decision Intelligence

Demand Forecasting, Inventory Allocation, Optimization Under Uncertainty, Scenario Modeling

Industry Experience

05 / 05

Systems Unlimited, Inc.

Data Analyst Intern

Iowa City, IA

Feb 2025 – Jun 2025

(01)

The Challenge

Operations leaders lacked timely, trustworthy visibility into incident and operational data. Reporting was manual and scattered across SharePoint lists, too slow and too fragmented to support confident day-to-day decisions.

(02)

The Solution

I built an automated analytics pipeline that fed interactive Power BI dashboards. Data flowed directly from SharePoint into Power BI, while stakeholder interviews shaped which metrics, filters, and views actually mattered to the people making operational calls.

(03)

The Outcome

Power Query transformed raw, inconsistent records into clean, reliable reporting tables, replacing manual spreadsheet work with a repeatable, refreshable system. The finished dashboards gave teams real operational visibility and turned reactive guesswork into faster, evidence-based decisions.

(04)

Technology

Power BI·Power Query·SharePoint·Excel·DAX

Contact

05 / 05

Open to work thatmoves the needle.

Open to collaborations in analytics, product, ML, or decision intelligence.